Charitable giving totaled $592.5 billion last year according to research conducted by the Lilly School of Philanthropy and published in Giving USA, The Annual Report on Philanthropy for the Year 2024. This is the first annual increase since 2021, when a record $643.8 billion was contributed, and represents a 3.3% increase over 2023 after inflation. Nearly three quarters of all giving was from individuals, including $392.5 billion in current giving and $45.8 in bequests, while giving from foundations was $109.8 billion and corporate giving totaled $44.4 billion.
The Giving USA study, first published in 1956, is the longest running summary of charitable giving in the United States. Since there is no centralized accounting of charitable gifts in the United States, the report employs sound and consistent methodologies to present sophisticated estimates of charitable contributions. Giving USA provides a trove of data and is a resource for understanding how charitable behavior has changed over time and was affected by the economy and events.
During the past four decades, total charitable giving has grown consistently, even after adjusting for inflation, as illustrated in this graph.
Figure 1
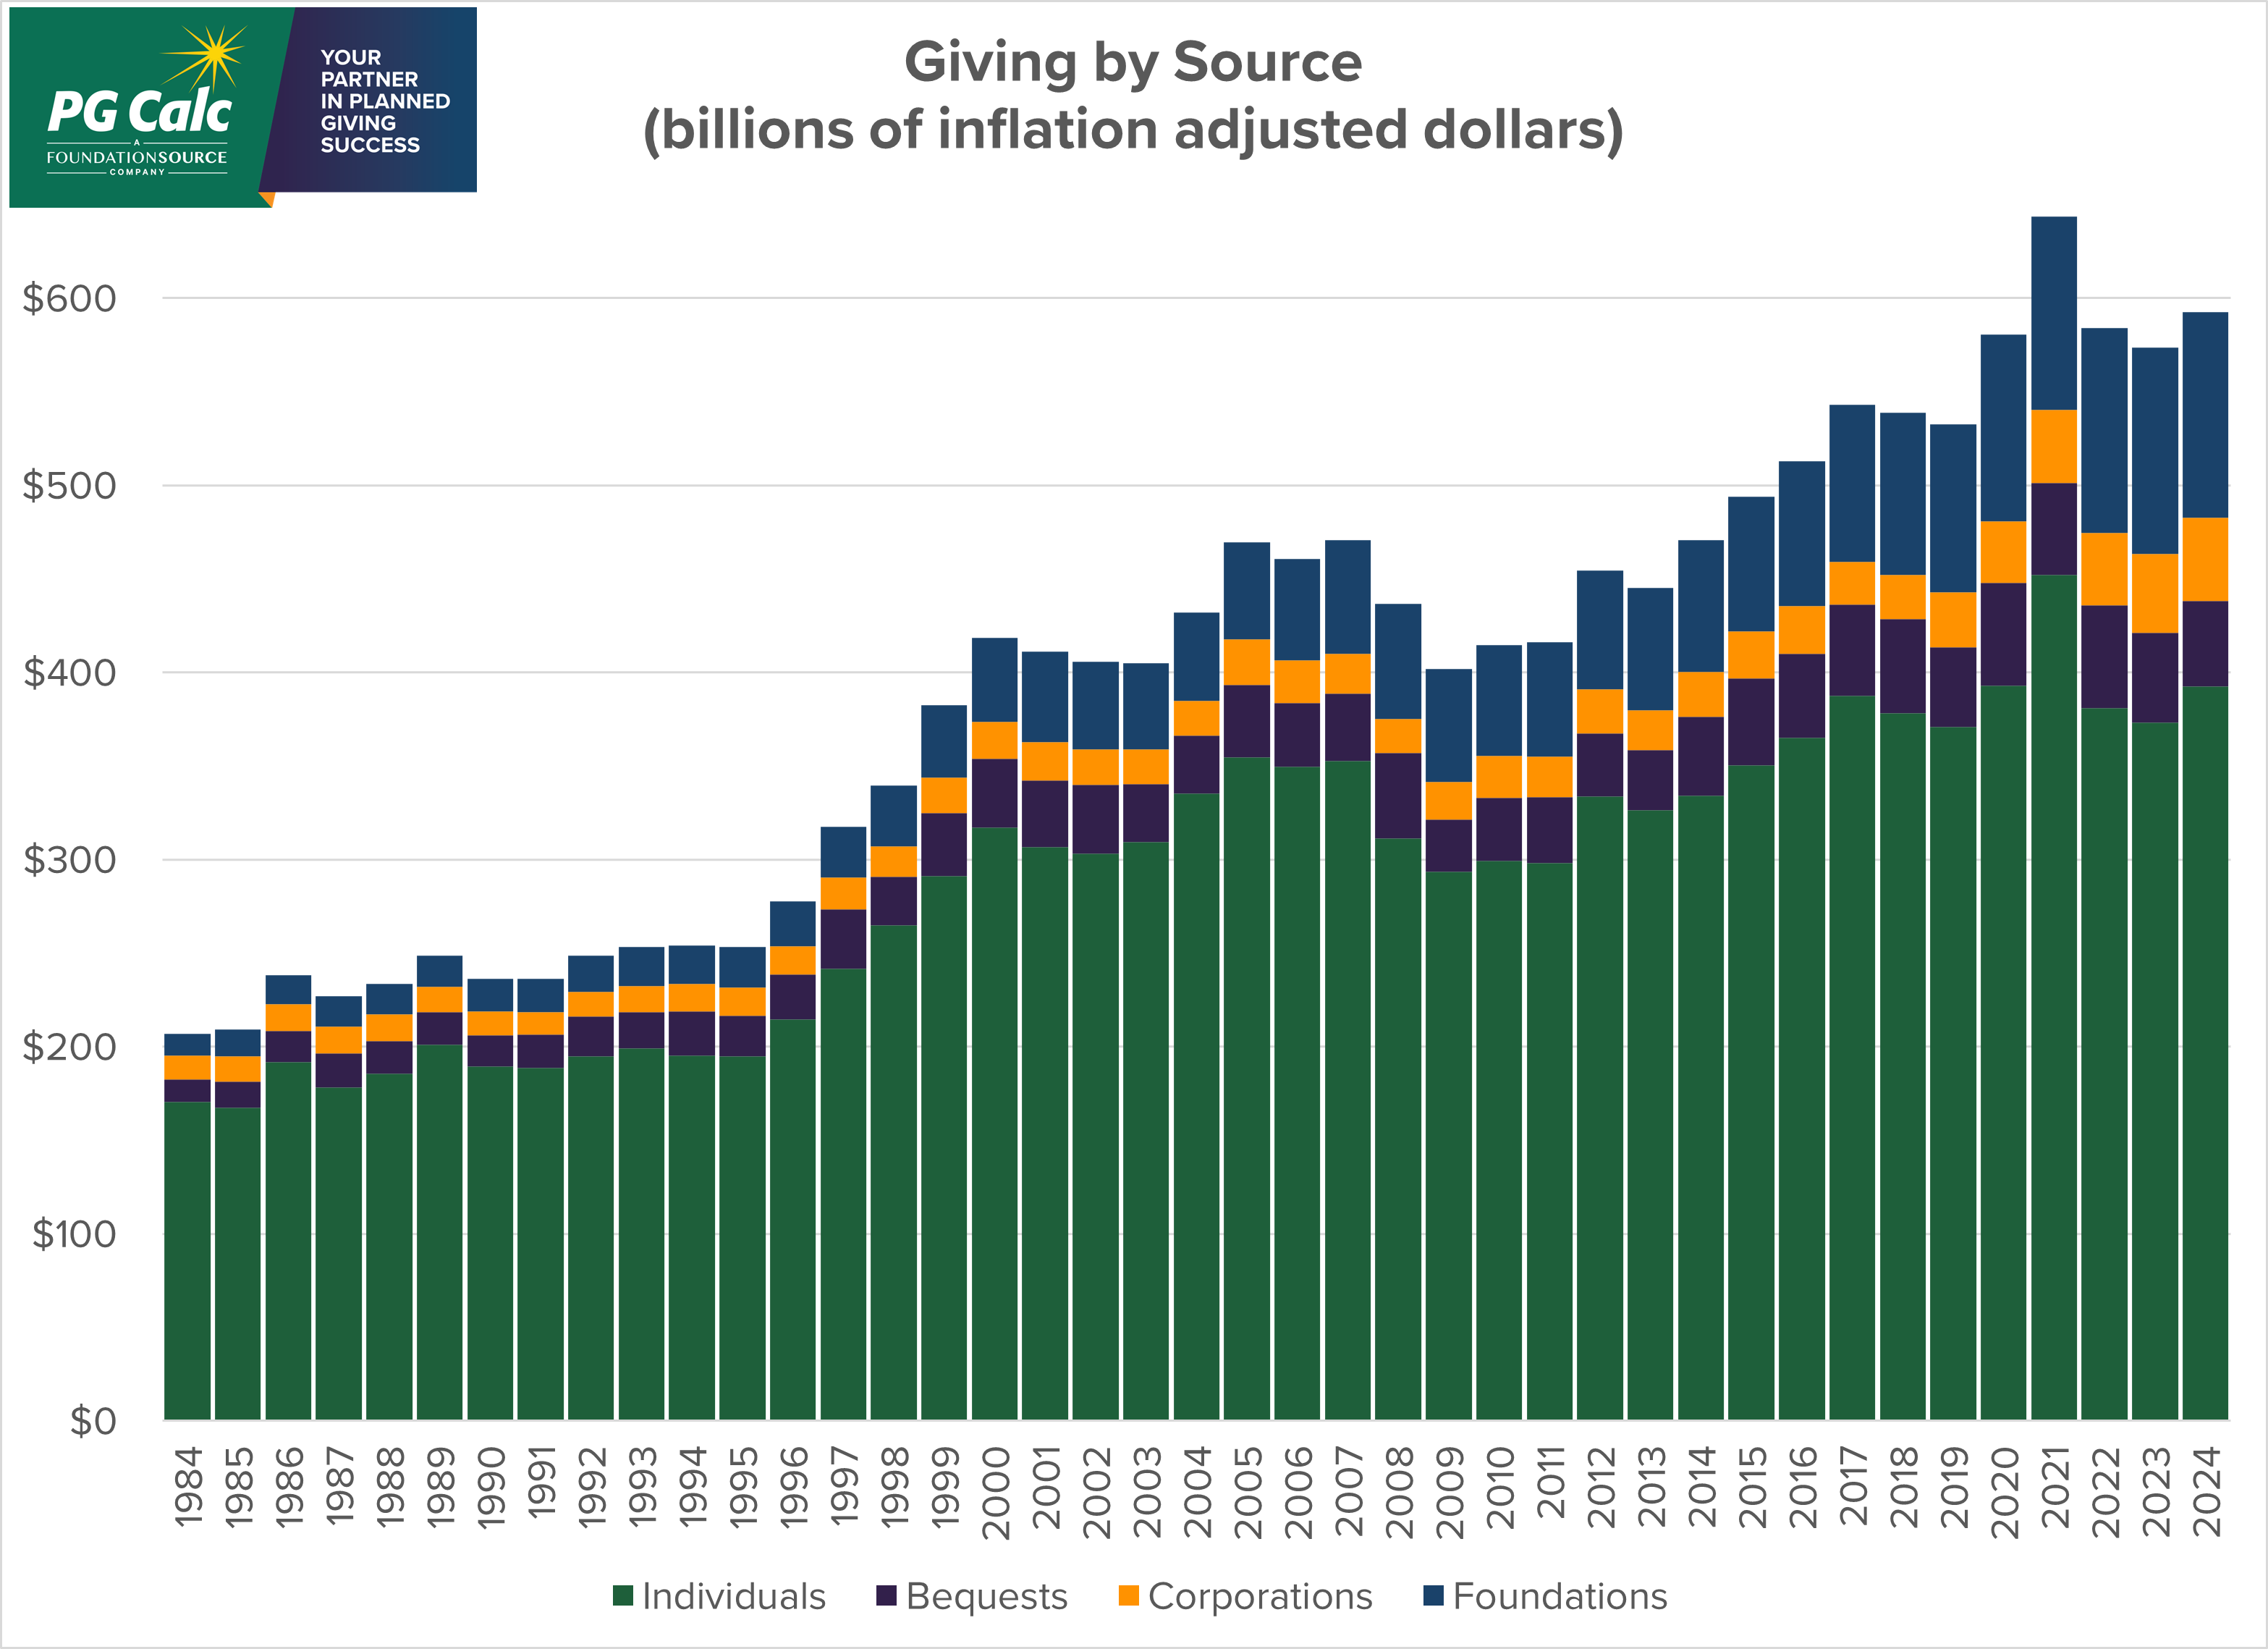
The data indicate neither changes in tax law nor past shifts in the balance of political power in Washington have had much impact on giving and reinforces that a growing economy has a positive impact on giving, sometimes lasting for several years. It is noteworthy that the share given by foundations has grown substantially during the period, from less than 6% to nearly 20%. This may reflect the growth of private foundations and donor advised funds, although the Giving USA methodology seeks to avoid double counting (i.e., individuals’ contributions to DAFs are reported in the Individual category for that year and subsequent distributions from DAFs are not reported under the Foundation category).
Beyond the broad totals, the Giving USA report points to some interesting trends: it appears charitable giving is becoming more variable from year to year and individuals are giving a declining share of their disposable income, although total giving has remained a relatively constant share of the overall economy.
Increasing Variability
Obviously, the past decade has been tumultuous. The world has weathered a global pandemic and its aftermath, the economy has been an unending roller coast ride, and our nation is experiencing an extraordinarily divided political environment. During this time, the nonprofit sector has faced growing expectations that it will fill gaps left when government programs are curtailed at the same time as it grapples with the sometimes-conflicting interests of nascent social justice and venture philanthropy movements. In addition, erosion of public confidence and trust in institutions, which began earlier in the century, has continued to affect perceptions of nonprofit organizations.
In light of these factors, it may not be surprising that charitable giving has been more variable in recent years. The graph below shows the annual change in giving, net of inflation, over the past decade for individuals (including bequests), foundations, and corporations.
Figure 2
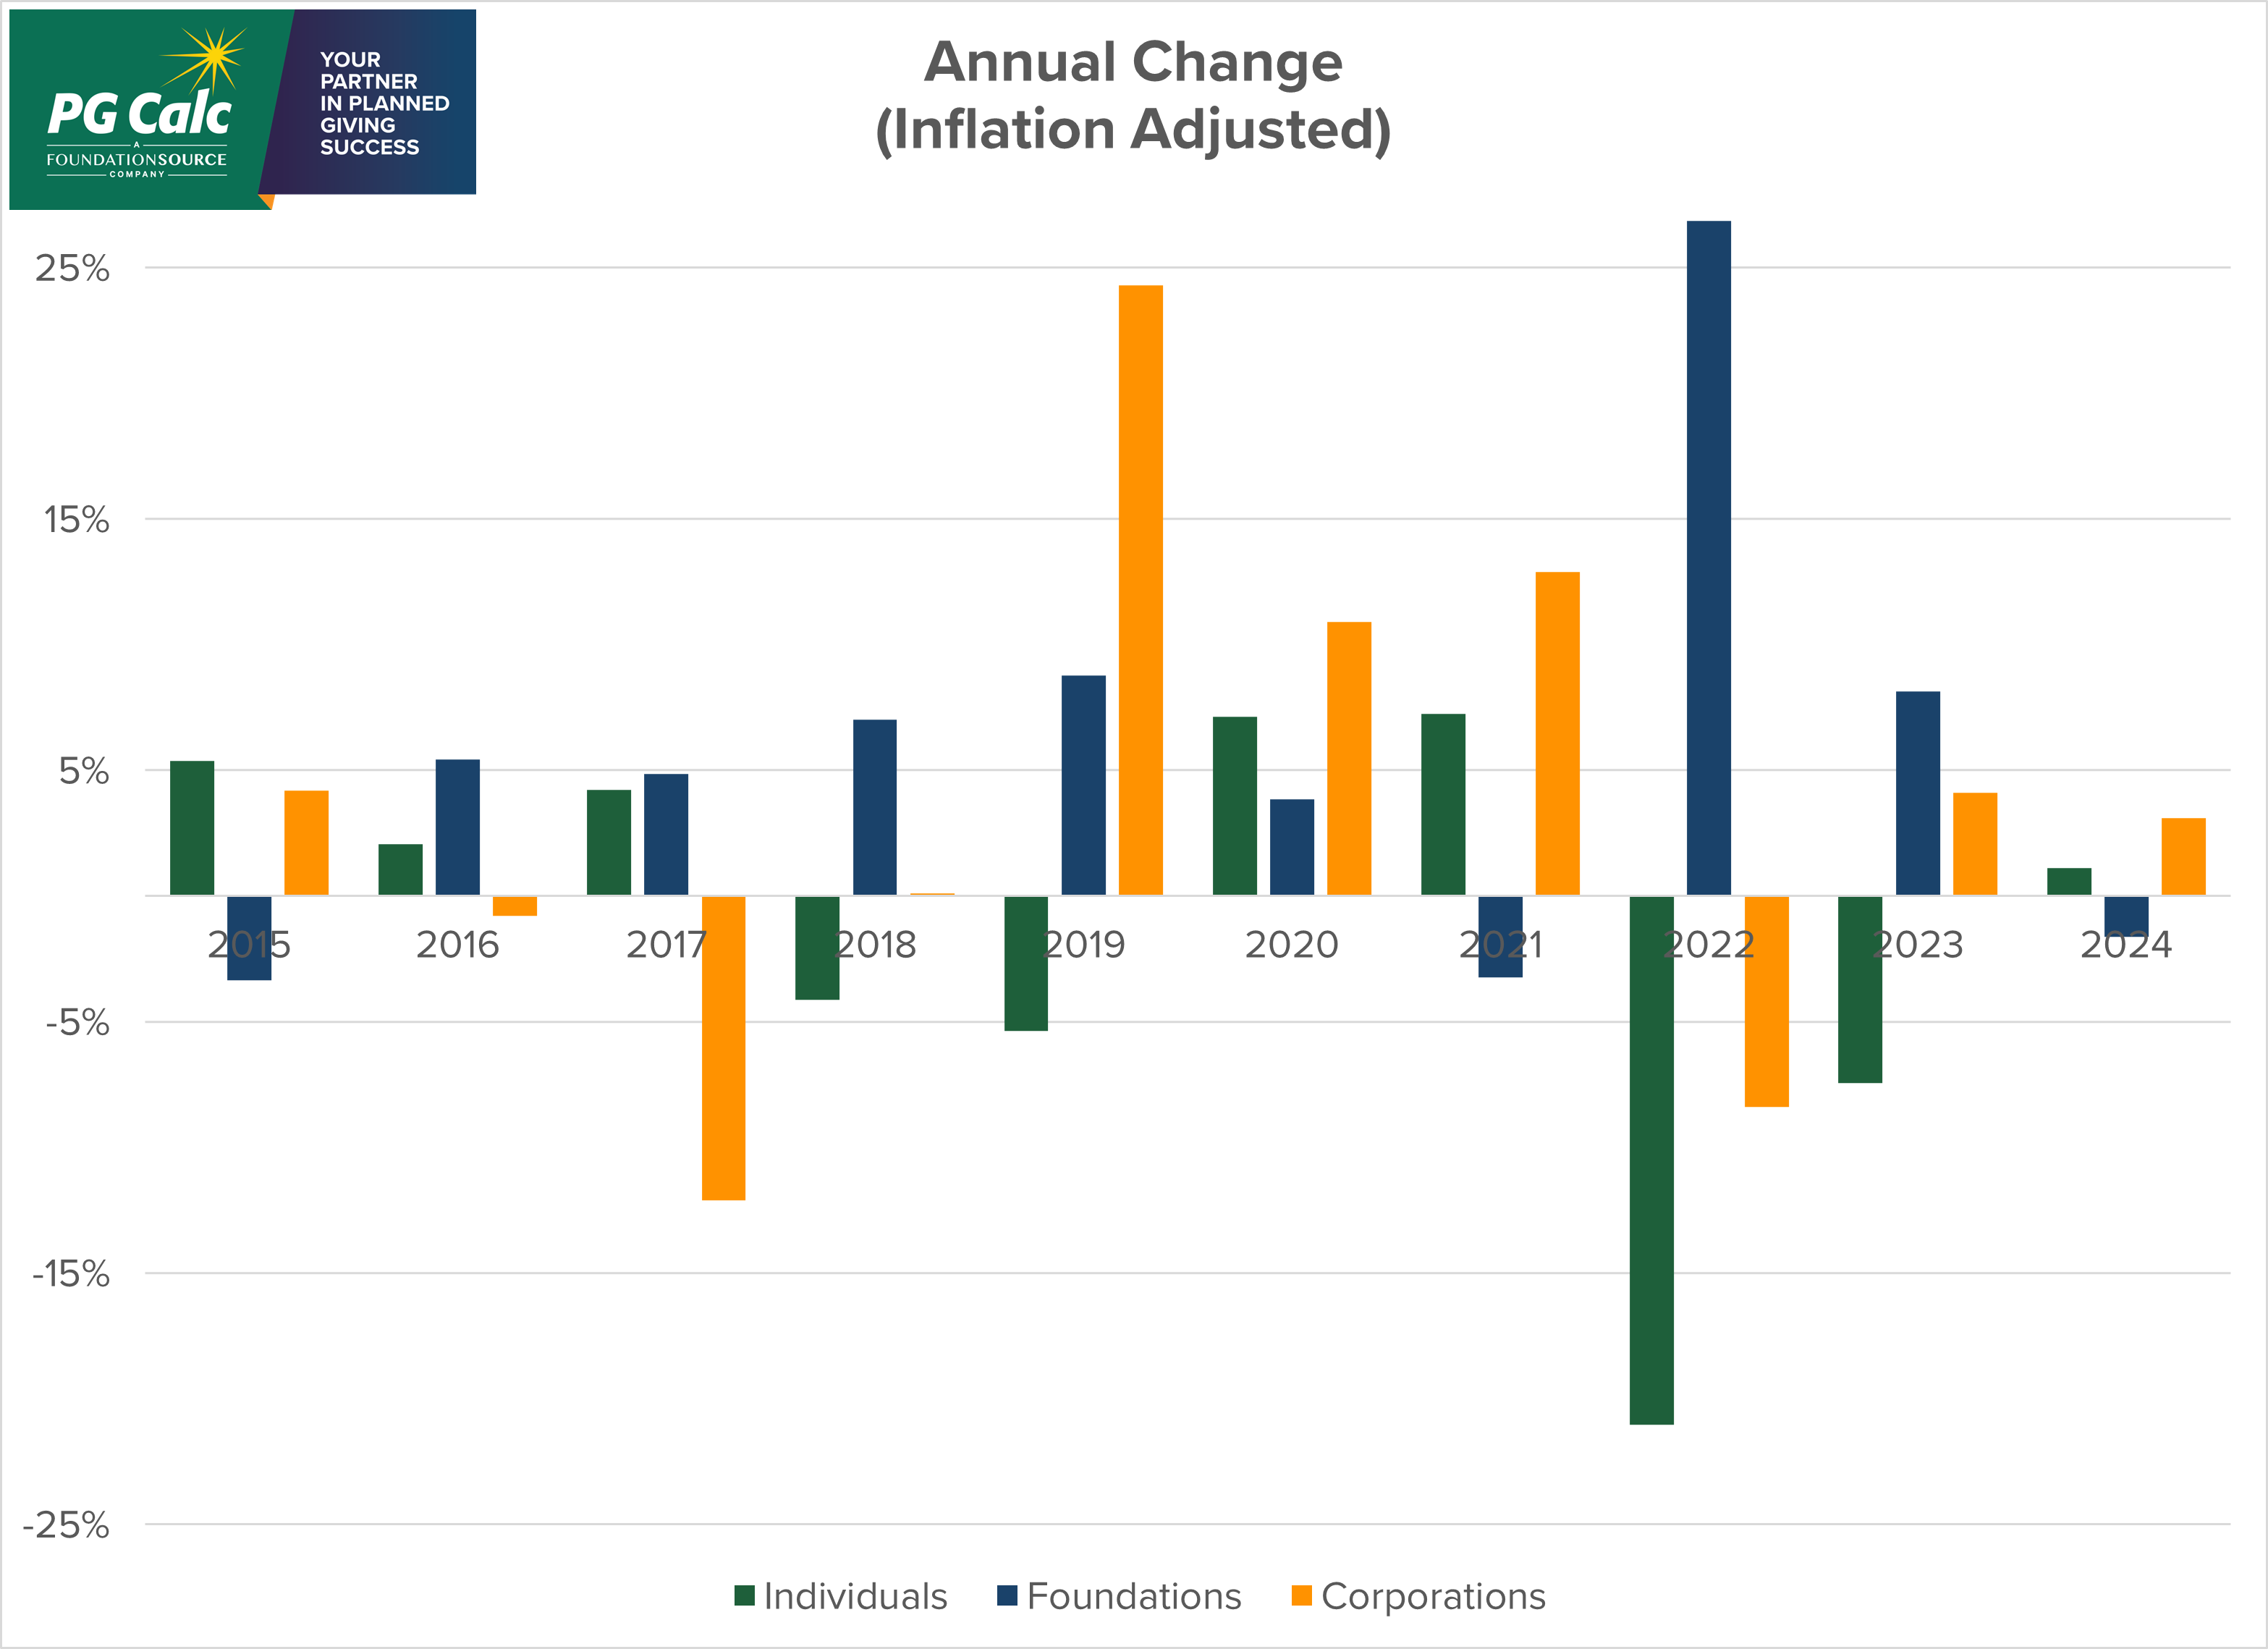
Interestingly, after reaching a peak in 2021, Total Giving declined in 2022 and 2023, led by a 21% drop in giving by individuals in 2022 which was only partially offset by a substantial increase in foundation giving. Individual donors still account for nearly three-quarters of total giving and led the way in 2024 while foundation giving remained flat. Still, Total Giving has yet to exceed the record setting level in 2021, which occurred in the midst of the Pandemic.
Share of Economy and Income
The Giving USA report includes intriguing analyses of Total Giving as a share of Gross Domestic Product (GDP) and Individual Giving as a percentage of disposable income. The GDP measure provides an indication of the size of the charitable giving sector relative to the total economy. Individual Giving as a percentage of disposable income provides a glimpse of how generous individual donors are in relation to their means. The graph below shows changes in these two measures over the past 40 years along with the linear trends.
Figure 3
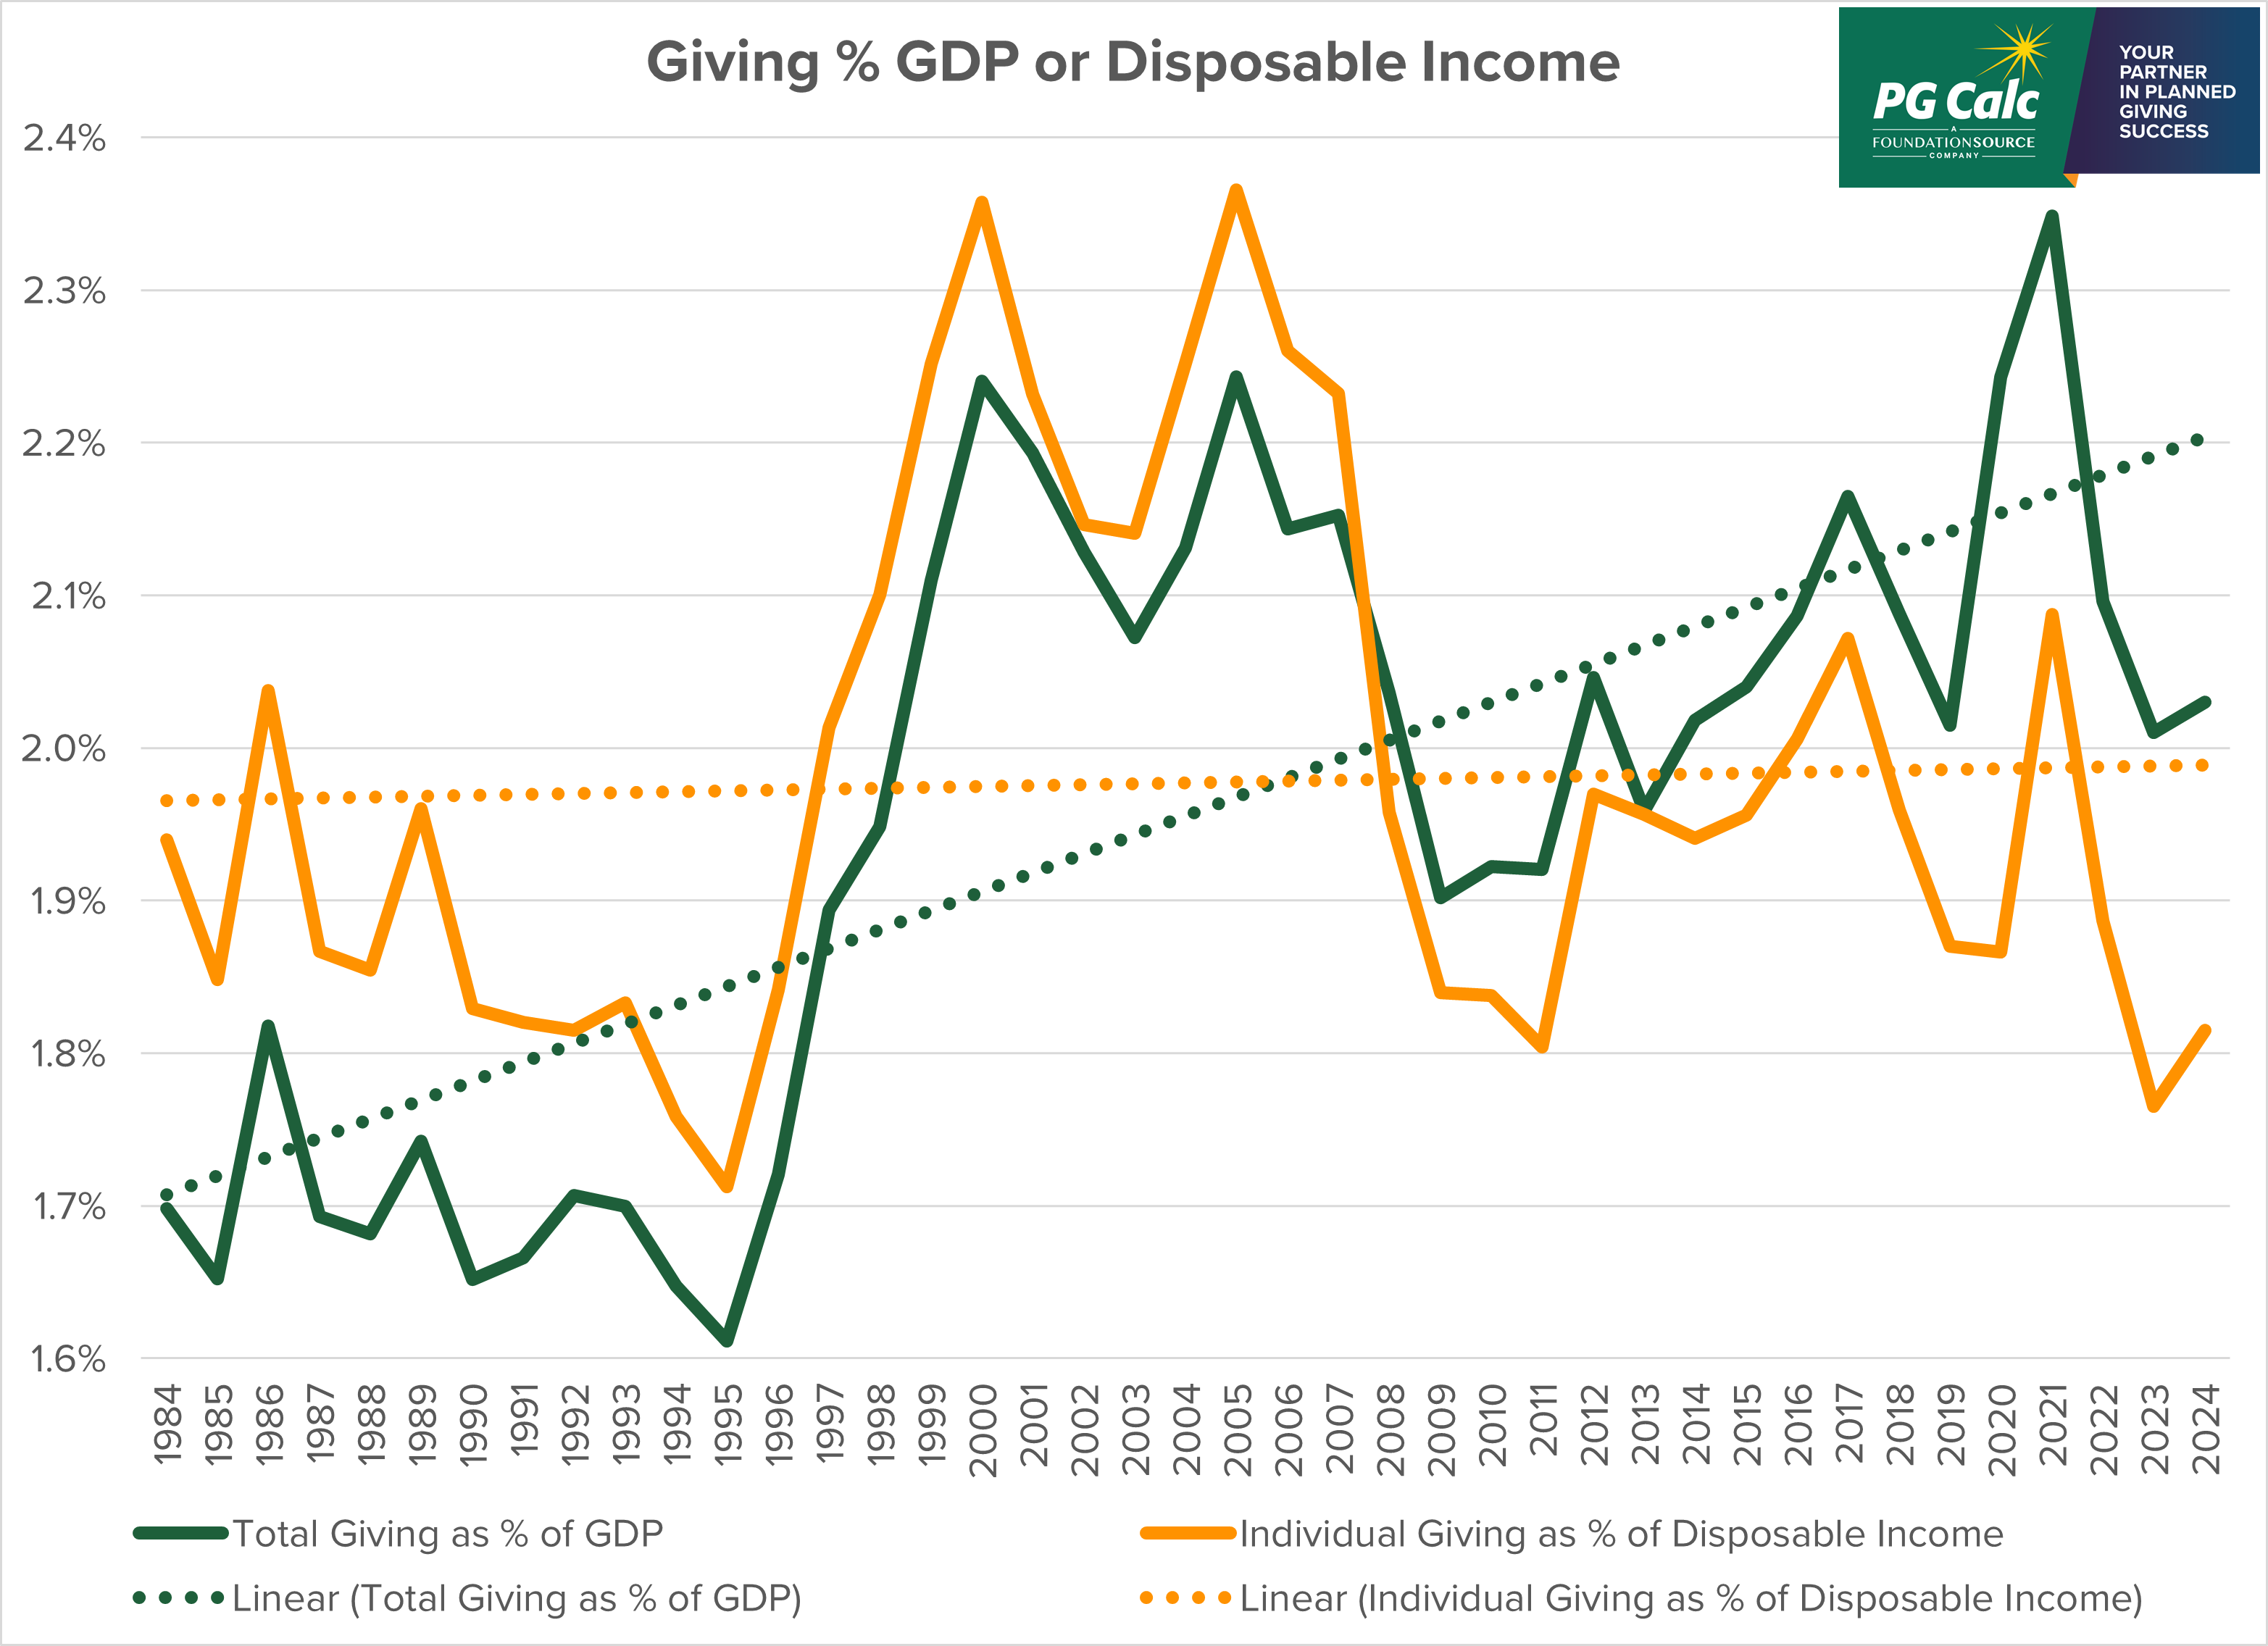
Not surprisingly, the two measures roughly track each other because a majority of Total Giving is from individuals. However, the trend lines for these two measures tell quite a different story. While Total Giving as a percentage of GDP is growing, Individual Giving as a percentage of disposable income has remained flat. There could be several explanations for this divergence.
During the past 40 years, Individual Giving has dropped from about 80% of Total Giving to around 75% while Foundation Giving has increased from about 5% to nearly 20%. Although Giving USA adjusts for contributions to and from DAFs, the increased focus on DAFs and private foundations may have led to a shift in the ways individuals give. It is also important to bear in mind: these are averages that could be affected by a long-term decrease in the percentage of the population who give at all and the increasing size of so-called “mega gifts.” Giving USA reports just fifty megadonors gave $16.2 billion in 2024, up more than one-third from the previous year.
However, another consideration is what these data might suggest for the management and productivity of fundraising programs. Although an increasing share of GDP is a positive indicator, it may be troubling that, despite the investments over the past 40 years in fundraising, management and metrics, cultivation and marketing, and datamining, Individual Giving hasn’t budged from about 2% of disposable income.
Conclusion
The data are, well, what they are. To be “data driven” may be a catchy buzzword phrase but, in reality, it is more important to be data informed. You are unlikely to find your next tactical step spelled out in the pages of the Giving USA report, but the data can inform your direction and strategies for a successful program. A Giving USA companion report entitled “Giving by Generation” presents the results of survey work with current donors and offers significant reason for optimism. The Baby Boomer generation continues to outgive other generations by a significant margin. There is a strong and consistent correlation between involvement and engagement on the one hand and giving. And the good news is the younger generations are even more likely to engage and become involved.
More than data and systems, fundraising is still a relationship business, and nowhere is that more true than in planned giving. Regular contact, opportunities for deep engagement, and compelling reasons to give are the keys to serving our donors and the causes they support.