“Drop in Giving Among Steepest Ever,” screamed the Chronicle of Philanthropy headline. Other media piled on. The anodyne Associated Press led with, “Charitable Giving Drops, Only the Fourth Time in 40 Years.” And the redoubtable Barron’s reported, “Charitable Giving Falls for the First Time Since the Financial Crisis.”
Is this all just hyperbole? Or does it leave you wondering if it might be time to hang it up and consider a different career path? Don’t despair. At least not yet. The release last month of the 68th Giving USA Annual Report on Philanthropy (Giving USA Report), which reported a drop of 10.5% in giving last year, triggered the hoopla. The Report is an initiative of the Giving USA Foundation in collaboration with the Indiana University Lilly Family School of Philanthropy.
It’s too bad the Report has been reduced to a headline because, well beyond a simple scoreboard of giving, it also provides a wealth of useful information and interesting insights about the history of and trends in charitable giving in the United States.
“How much do Americans give to charity each year?” seems like a simple question, but the answer turns out to be remarkably elusive because there is no single point to measure charitable giving with precision. Donors make contributions in a welter of different ways and forms. Some contributions are deducted on income tax returns, but many are not, so U.S. Treasury data do not provide a full picture. Some professional associations – CASE and AHP among them – survey fundraising results among their members, but these reports reflect only sector-specific giving. Assessing total contributions from charitable bequests is especially challenging because few estates file estate tax returns and the payouts to charity are often spread over a period of years. Tallying donor-advised funds is complicated because there are two gifts involved: one from the individual donor and another when the sponsoring foundation makes the distribution to the ultimate charitable beneficiary.
It is important to acknowledge and understand the limitations of the Giving USA Report. It is not a precise tally of total charitable giving. It is an estimate – a survey – of charitable giving. Most readers (and certainly those headline writers) focus on the top line numbers but don’t seem to consider the dozen-and-a-half pages toward the back of the Report that explain the sources and methodologies used to arrive at the estimates. What is more, the Giving USA Foundation routinely adjusts past reported results – sometimes years after the fact – as new data become available.
Nevertheless, the Giving USA Report is a good source of information and provides interesting glimpses into Americans’ giving, allowing us to draw inferences about long-term giving trends. The chart below shows giving, adjusted for inflation, by source over the past four decades. Although the overall trend has been positive, year-to-year declines are not unusual. Total giving has increased by 56%, after inflation, over the forty-year period, an average of 1.4% per year. Giving from individuals has grown the fastest, 83%, for an average of 2.1% per year more than inflation. For comparison, 2.5% real GDP growth is considered ideal by the Federal Reserve.
It is interesting to note the way giving among the sectors has shifted over the years. Forty years ago, giving from individuals accounted for more than 80% of total giving. Last year it was just under 64%. Meanwhile, foundations, which accounted for less than 6% of giving in 1982, now account for more than 21%. (Note that, although foundations make distributions from donor-advised funds, those dollars are not reported as contributions from foundations.)
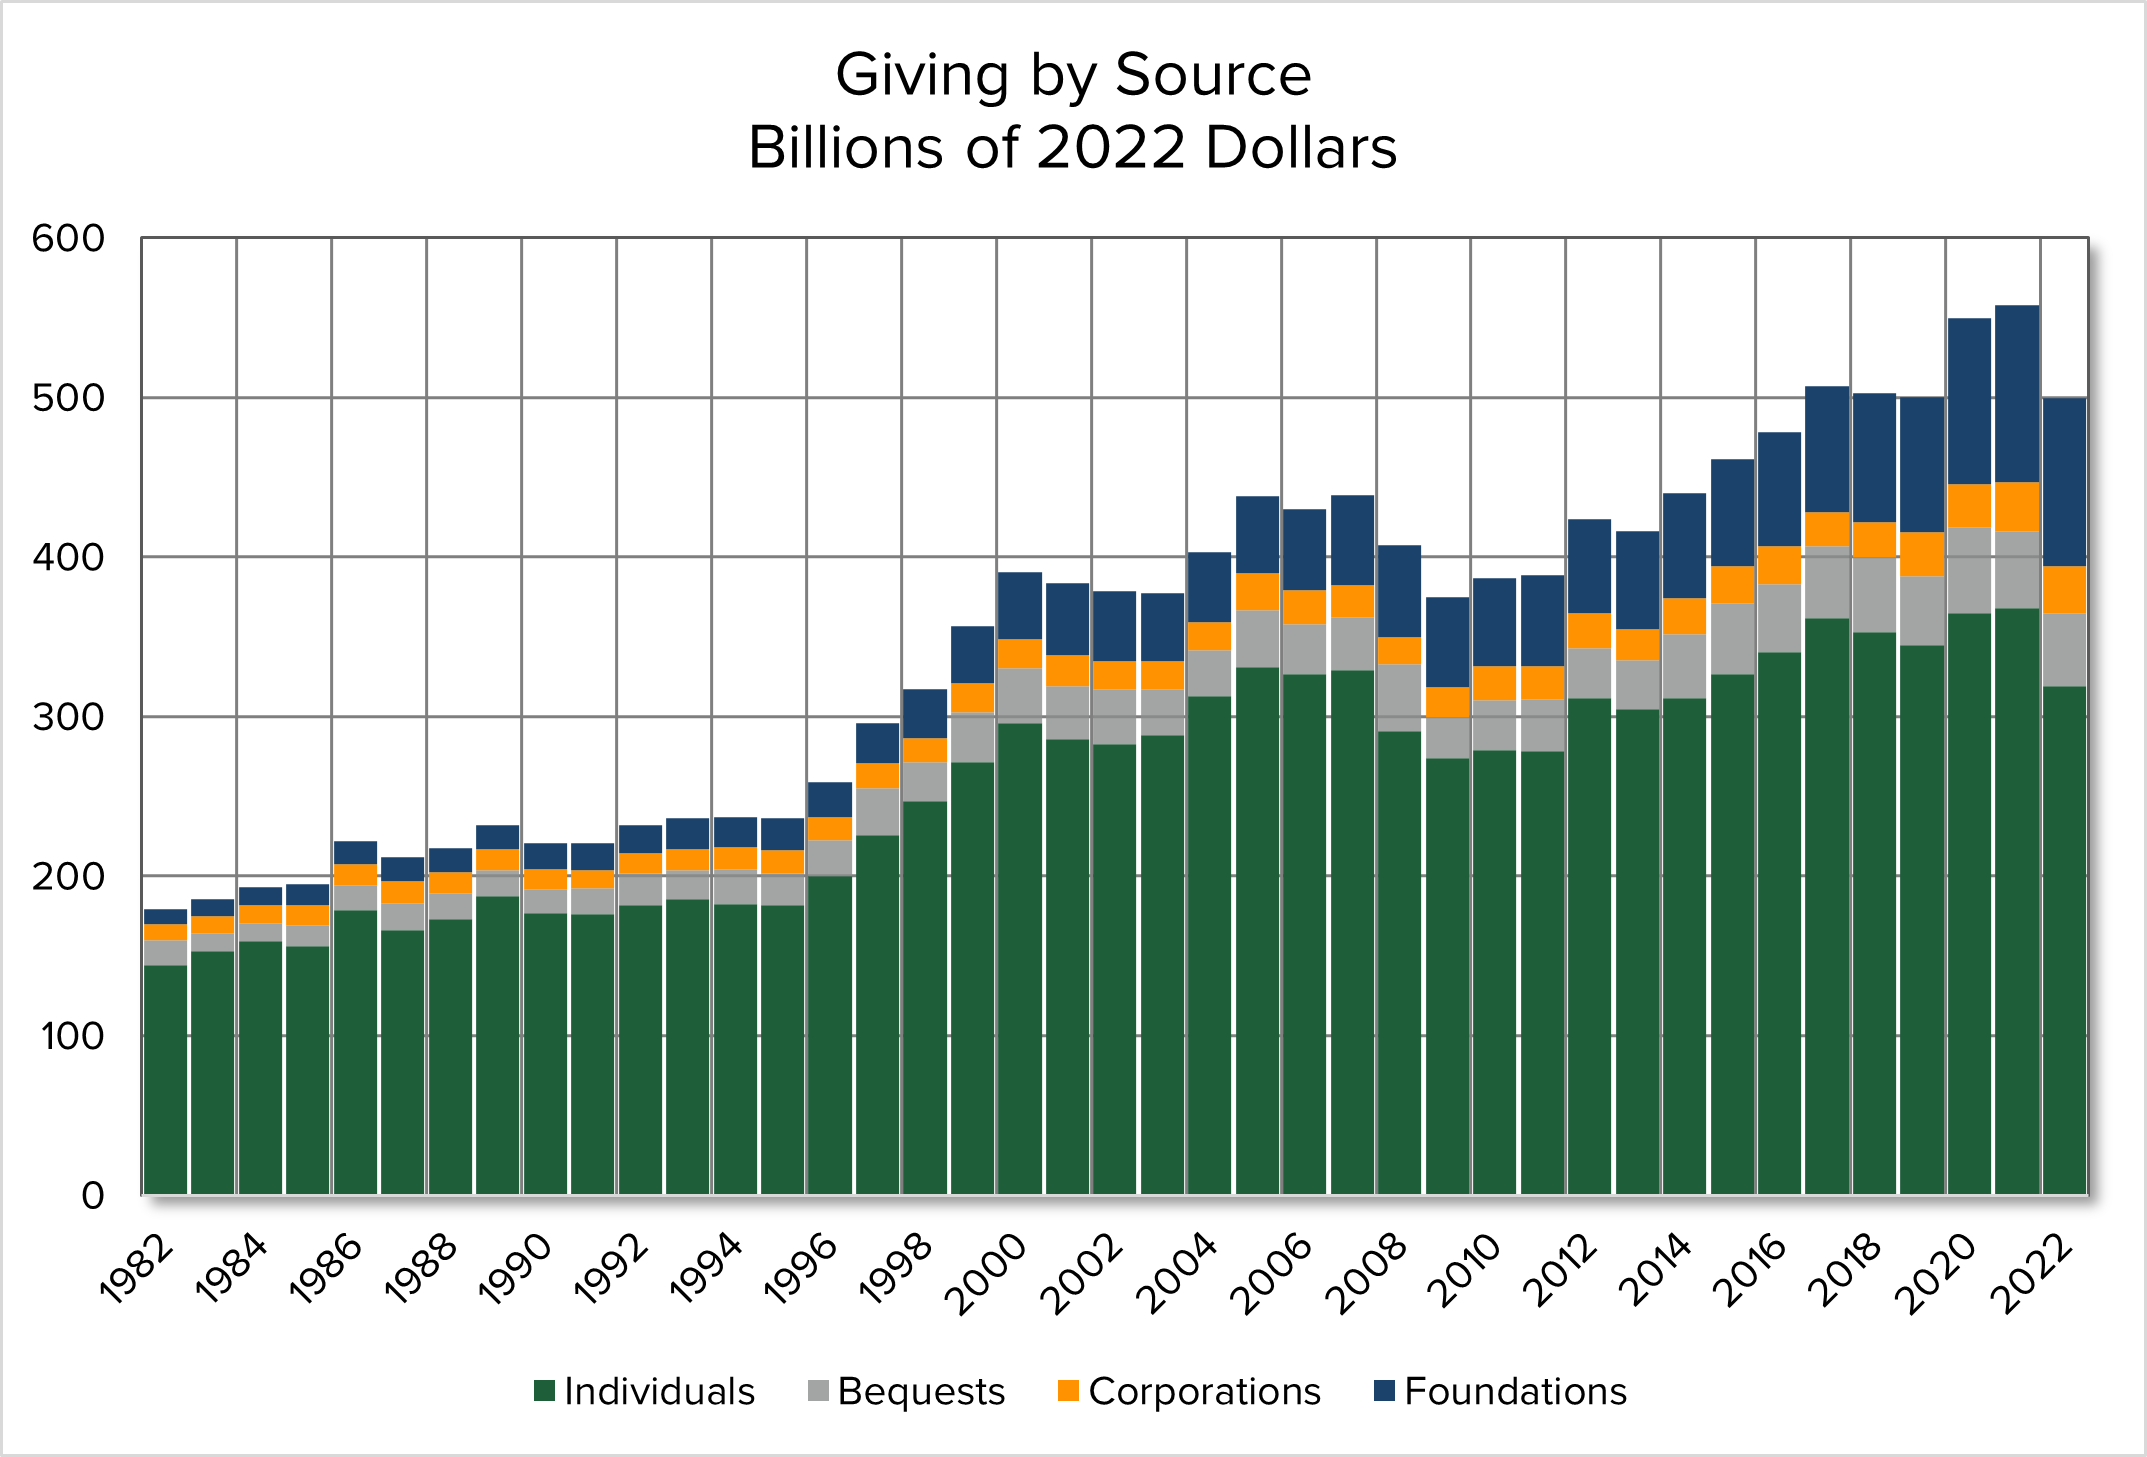
Data Source: 68th Giving USA Annual Report on Philanthropy
Beyond simple year-to-year comparisons, one of the more interesting uses of the Giving USA Report is to look back at historic events to see how giving changed in subsequent years. Our donors make their giving decisions in a context that includes tax policy, the economy, the stock market, and events like the tech boom and bust, the Great Recession, and 9/11. The Giving USA Report provides an opportunity to examine how donor behavior changed following past events.
Tax Rates and Policy
Debate has raged for years about the impact of tax rates on charitable giving. One logical argument is that decreasing taxes increases disposable income, which makes more money available for charitable contributions. The counter argument is that lower tax rates increase the after-tax cost of giving because of the corresponding decrease in tax savings. In 1981 the first of the Reagan era tax cuts decreased the top income tax rate from 70% to 50% and cut the capital gains rate from 28% to 20%. During the five years following, giving from individuals increased at about twice the average rate. However, giving from individuals declined slightly in the five years following the second Reagan tax cut in 1987, which reduced the top income tax rate from 50% to 38.5% and then to 28%. Even more perplexing, during the five years following the Clinton tax hike of 1990, giving from individuals increased an average of 4.5%. However, it must be noted that period also included the economic expansion of the dot-com boom.
Politics
We live in a politically divided nation. Inevitably, it seems, about half of us would argue that one party or the other is more favorable for charitable giving. One stereotypical belief is that the Republican party has generally favored pro-business and pro-growth policies that ought to enhance opportunities for charitable giving. The Giving USA Report undermines this conclusion. A Republican has been President for 23 of the years covered in the report, and giving from individuals has increased an average of 1.3% annually during those years. However, giving from individuals increased an average of 3.1% during the years when a Democrat was in the White House. A similar pattern holds for the balance of power in Congress.
Stock Market
It is intuitive, and our experience confirms, that a booming stock market is good for charitable giving. The Giving USA Report bears this out, at least in part. The Standard & Poor’s 500 Index (S&P 500) is a useful proxy for the “stock market.” The S&P 500 has been highly variable over the past 40 years with annual total returns as high as 37.6% in 1995 and as low as minus 37% in 2008 at the beginning of the Great Recession. However, the strength of the correlation with giving from individuals is mixed. In 1995, when the total return was positive 37.6%, giving from individuals declined 0.1%. On the other hand, in 2008, at the dawn of the Great Recession, the S&P 500 posted a loss of 37%, and giving from individuals declined 11.6%. In 1987 the S&P 500 suffered its largest single day loss in history, losing 22.6% in one day, but managed to post a positive total return of 5.3% for the year and yet giving from individuals declined 7.1%.
The Economy
The Giving USA data suggest a consistent correlation between overall economic performance and charitable giving. However, with the exception of the Great Recession of 2007-09, the effect seems to be short-term. Economic recessions in 1990-91, 2001, and the Great Recession of 2007-09 were all followed by declines in giving from individuals, which dropped an average of 5.5% per year during the Great Recession but gained an average of 2.7% per year during the five years following. On the other hand, economic growth is related to increased giving. The dot-com boom of the late 1990s is associated with sustained increases in giving from individuals averaging more than 10% per year.
Disaster Giving
The Report also provides an opportunity to examine the proposition that Americans respond generously during natural disasters and times of adversity. Despite this deeply held belief, the Giving USA Report provides a mixed review. For example, in 2001, the year that included the 9/11 attacks, giving from individuals dropped 3.3%, although in 2005, the year of Hurricane Katrina, giving from individuals increased 5.8%.
Giving as a Percent of Gross Domestic Product and Disposable Income
Another measure of giving is the percentage of available funds that are contributed. The following graph shows total giving as a percent of Gross Domestic Product (GDP – a measure of total economic activity), giving from individuals as a percent of disposable income, and corporate giving as a percent of profits. Total giving and giving from individuals have hovered around 2.0% of GDP and disposable income respectively, although it is interesting to note that total giving and giving from individuals paralleled one another early in the period but have diverged in more recent years. Meanwhile, corporate giving as a percentage of profit has fallen significantly, especially during the period beginning at the end of the dot-com boom.
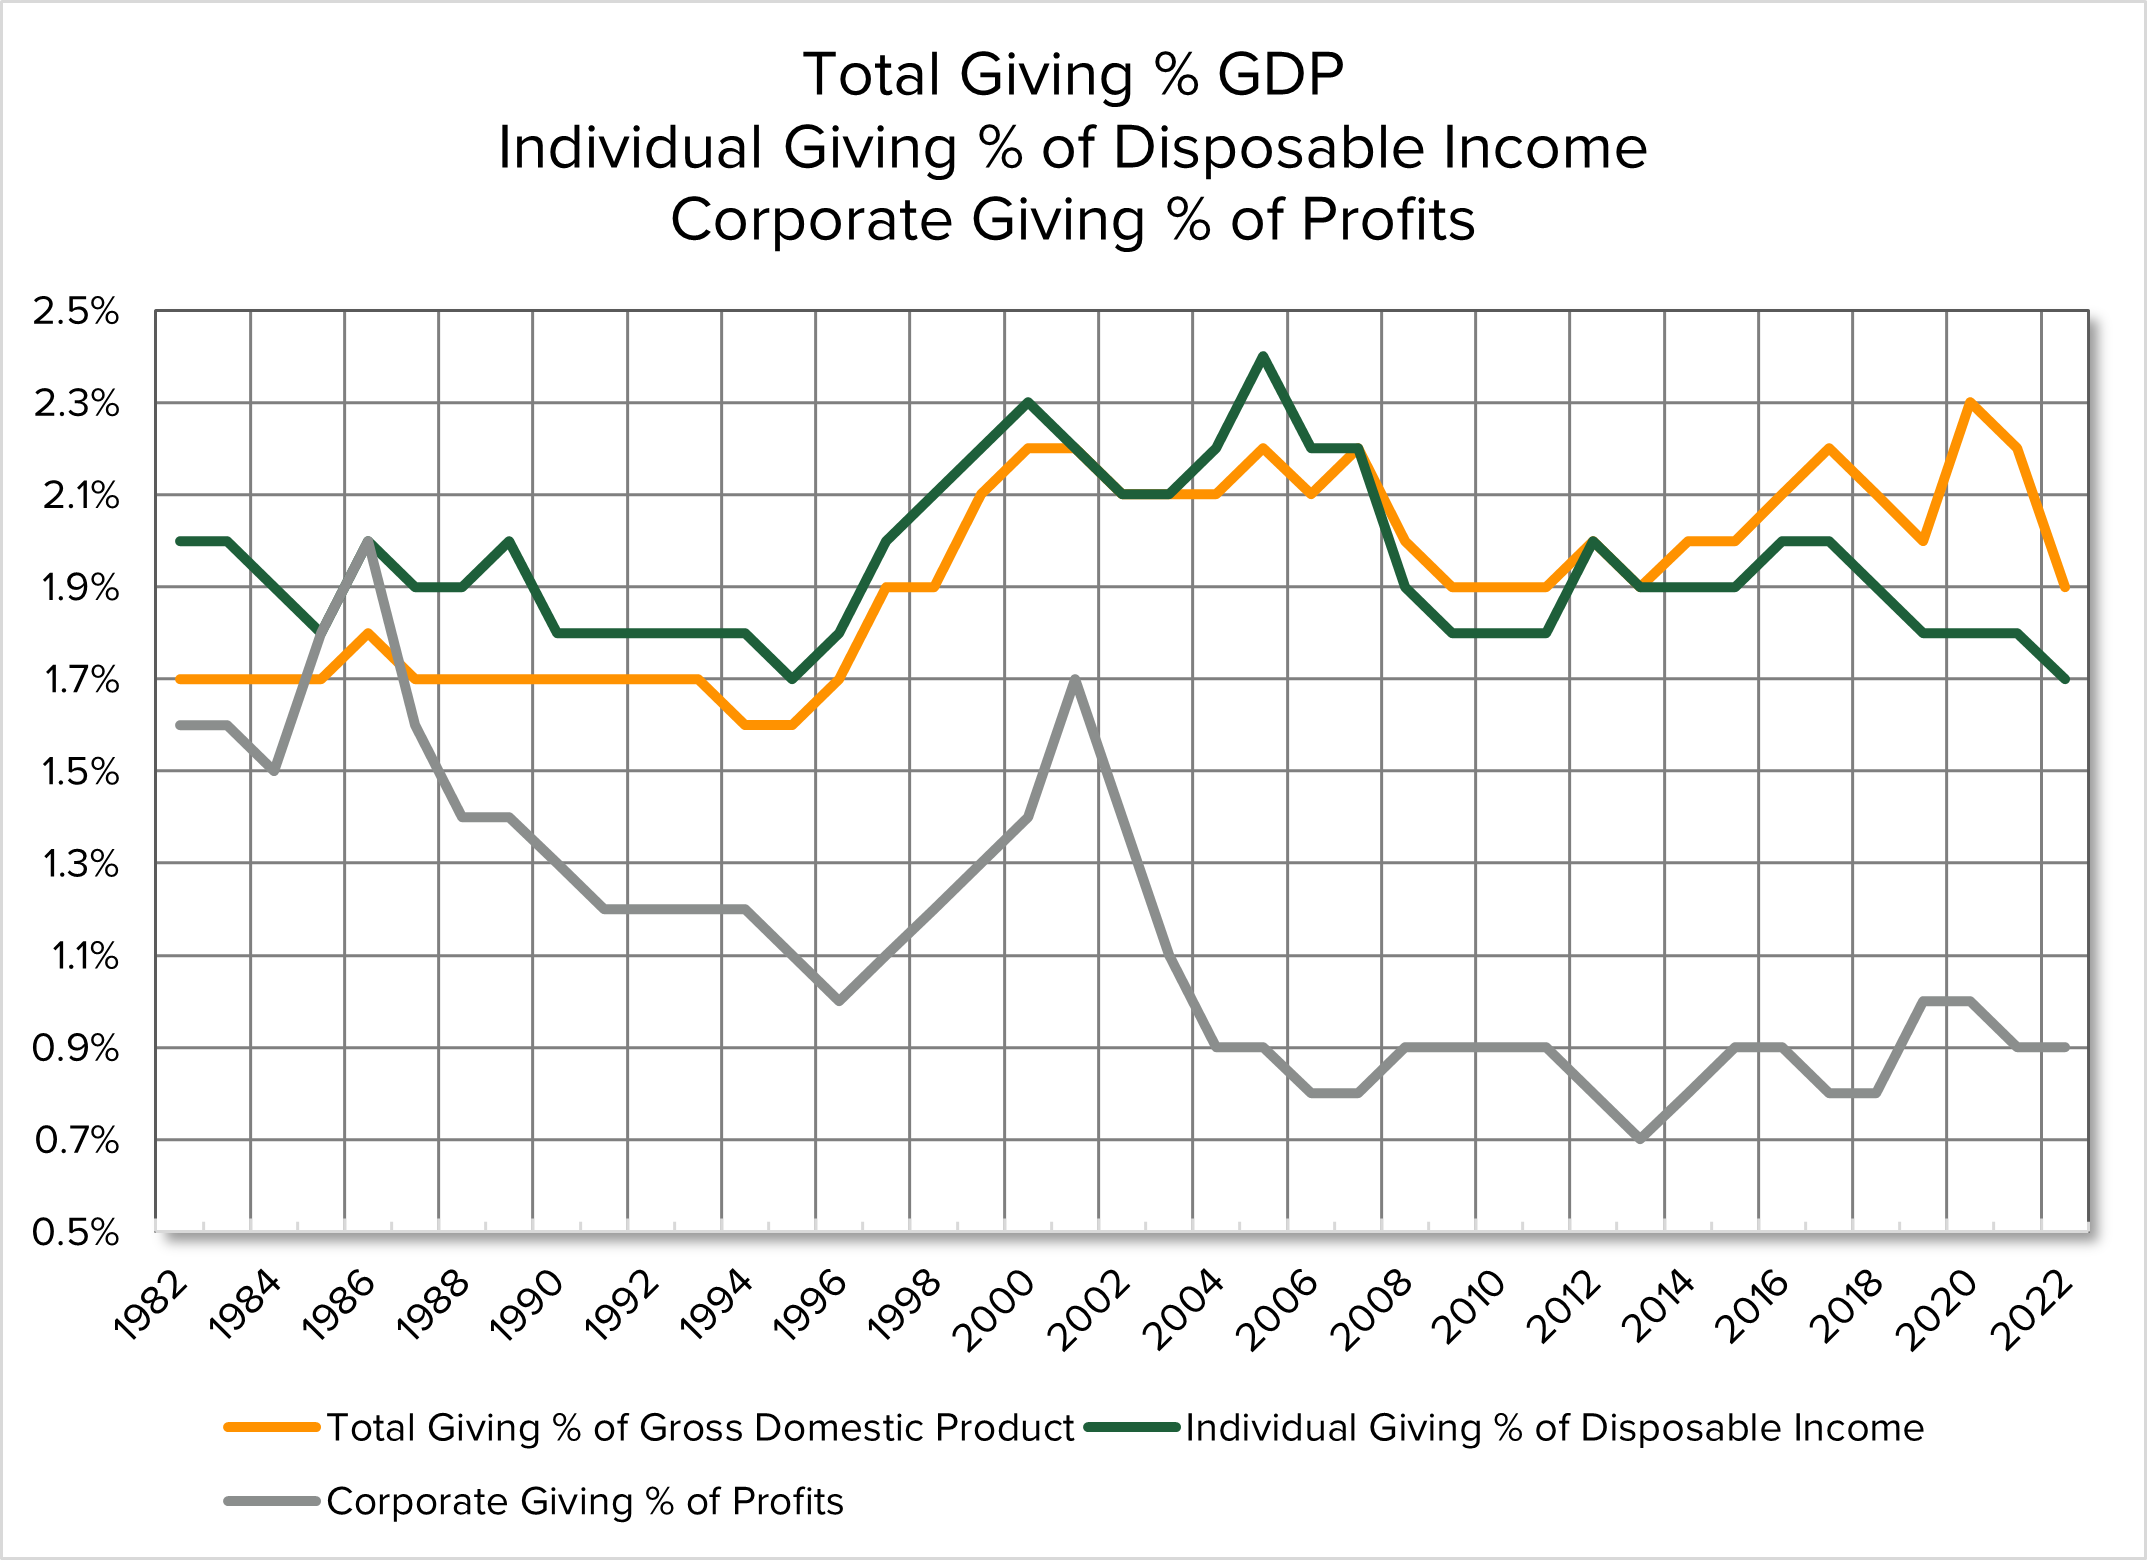
Data Source: 68th Giving USA Annual Report on Philanthropy
Conclusion
So, back to those screaming headlines. Was 2022 truly a bad year? Alas, it seems so. In 2022, estimated total giving dropped 10.5%, and giving from individuals declined 13.4% compared to the year before. These were the largest drops in the four decades covered by the report. Even worse, giving from individuals has declined, year-to-year, in five of the 12 years since the end of the Great Recession of 2007-09 and is a shrinking percentage of disposable income.
As the graph below shows, giving from individuals is quite variable year-to-year. Investment advisors often use standard deviation and trendlines as tools to help understand volatility. The standard deviation for giving from individuals over the past 40 years is 6.3%, which suggests we should not be surprised by annual variations between plus 8.4% and minus 3.0%. Clearly, the 13.4% drop in 2022 was, in fact, a bad year and continues a downward trend.
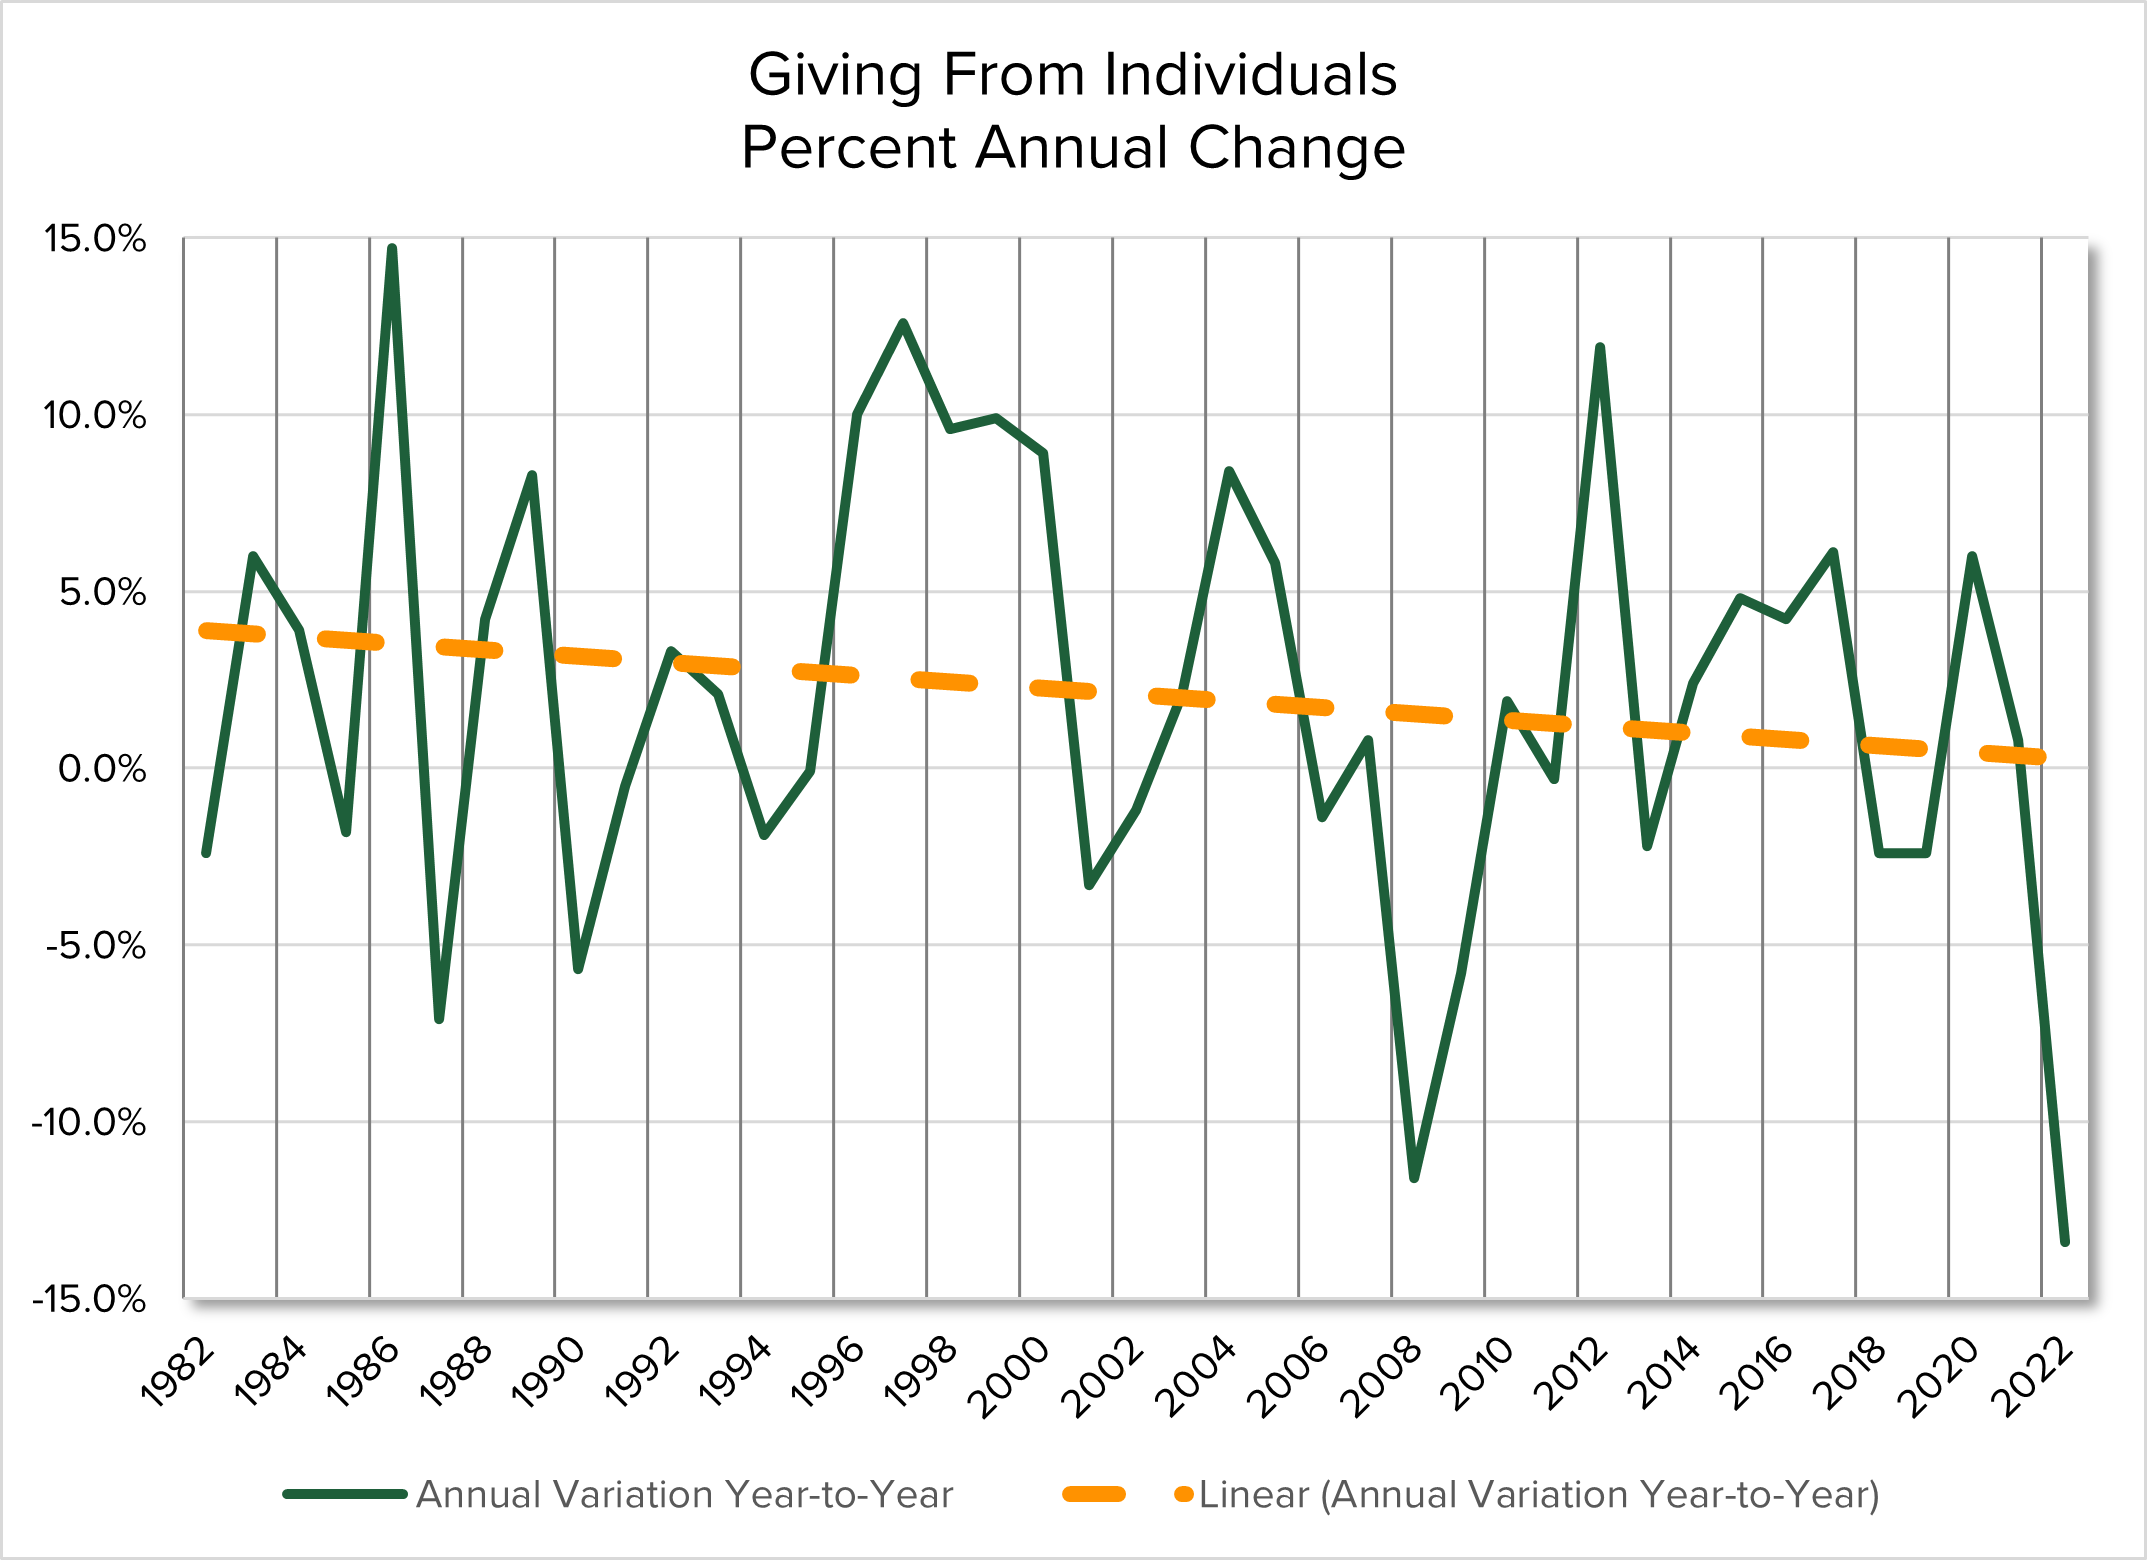
Data Source: 68th Giving USA Annual Report on Philanthropy
However, reducing the Giving USA Report to a breathless headline about year-to-year declines oversimplifies the complexities of American philanthropy. Nothing in the Giving USA Report should obscure an enduring truth: donors continue to find reasons to make generous contributions to causes that matter to them. Even as the stock market booms and busts, the economy grows and contracts, and tax laws change in ways favorable and not, donors continue to give. And our job, as gift planners, is to help our donors make the smartest gifts possible.